Innovation is about people not products
Paul Bosher: 1st June 2022
I don't want to be mean... averages can be incredibly helpful but increasingly I believe they get in the way of great insight
An old statistician's joke tells how if you put your feet in the fire and your head in the freezer on average you'll feel fine. That's what I mean when I say average is the enemy. It's data, and in particular people data, where averages are often over-used, usually with the intent of providing consistent reporting but instead masking the truth behind what people are really thinking or feeling.
In a world that seems to be increasingly binary in its dialogue - "I'm right, you're wrong", "This works, so that doesn't" - I see many situations where companies are looking for a definitive answer, the score. This is where averages come into play, almost every metric on a modern scorecard is an average. These, of course, must be compared to last week/month/year or the competition. There is comfort and simplicity in the single score, but there is also danger, laziness, and the potential to miss out on genuine insight.
Let me give you a simple example; in any employee survey you'll be given average scores for the company, and these might be cascaded down to country, department, or location. These will of course be benchmarked using another average of lots of other companies but giving you that all-important score, albeit a potentially meaningless and misleading one.
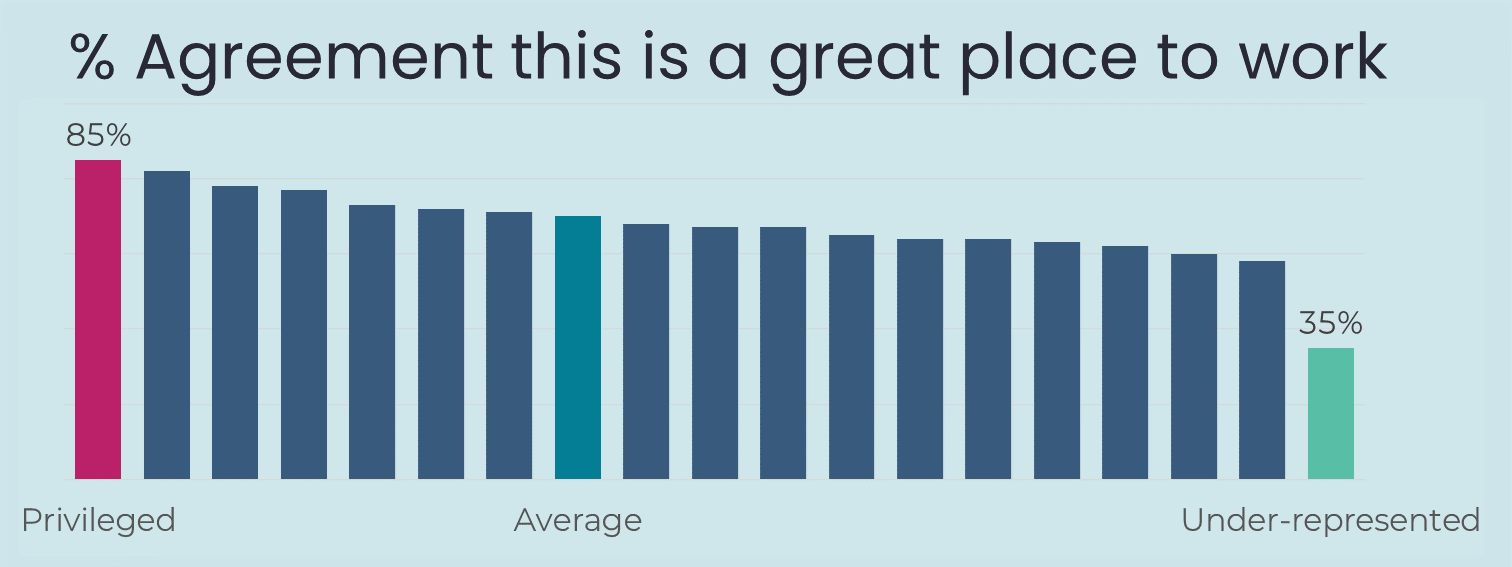
In the same engagement survey you have an average score of 70% for
"I would recommend x as a great place to work", the variation across departments is between 65%-75%. So you may start thinking about what remedial action plan is needed for poor old department A with 65%, while department B at 75% get cake, a pat on the back, and maybe an extra half-day holiday.

However, we are still looking at averages Instead we should be looking at specific data for differences, from the perspective of the individual, or small groups of like-minded individuals. In this real set of data, we found a small cohort of very similar individuals, let's call them "under-represented", who have scores of 35%. On the flip-side, we have other more "privileged" cohorts scoring at 85% giving us our average of 70%.
It also transpires that Department A isn't doing a worse job, they just have a larger proportion of the
under-represented groups.
By using averages it's easy to say that at 70% overall we are doing ok, dig deeper and you might conclude that we have some work to do in certain departments or divisions. However, Turn the data on its head, look at the individual data for differences, build from there, and the conclusion is very different.
Sometimes we need to aggregate data and it makes sense to create averages for reporting or comparison, but I see this increasingly being the only way that data is used. We sometimes need to think differently, think at the individual level and build rather than the collective level and drill down. If you ever think you're not getting the insight you should from the data, I suspect that somewhere that old enemy average is doing its thing and there is a chance your brain is frozen and your feet are on fire.